As part of the work I’m doing in the Neosensory Community Research Program, I wanted to explore motion sensor data from a mobile device and establish if it would be possible to detect balance and gait of the phone’s user. I was interested in charting the data in real time so I could visualise the sensors as I moved the phone. There were two approaches to getting motion data from a mobile device:
- Write a native app, ideally cross-platform, with something like Flutter
- Write a web-based application using JavaScript Web APIs
I chose the Web API approach for fast iteration and easy sharing with others in the team. Web APIs are built into modern browsers which we’ll look at next.
Web APIs
So what can you do with the Web APIs? Quite a lot it turns out! There are APIs to access a device’s hardware interfaces and filesystem, helpers to load content, store data and most interestingly, to access a device’s sensors.
A caveat: many of these API’s are experimental and may have incomplete or differing implementations across browsers - so proceed with caution!
For accessing a mobile device’s sensors, we have two options:
These are defined in the W3C spec
The Sensor APIs offer access to:
- AbsoluteOrientationSensor
- Accelerometer
- AmbientLightSensor
- GravitySensor
- Gyroscope
- LinearAccelerationSensor
- Magnetometer
- RelativeOrientationSensor
Device Motion Event offers:
- Acceleration
- Acceleration including gravity (orientation)
- Rotation rate
Many of the Web APIs are experimental and so there are some browser compatibility issues to be aware of. At the time of writing, the Device Motion Event offers better browser compatibility, so I decided to explore that.
Getting the mobile motion data
We can subscribe to events using an event listener. However, for data privacy reasons, a number of devices (notably Apple) require user consent before the sensors and motion events can be accessed.
Asking permission
For iOS 13+, we must ask permission and check the permission has been granted before we can add the event listener. This code can be triggered by a button and in turn, brings up a native permission pop-up to allow or deny consent.
function requestPermission() {
  if (typeof DeviceMotionEvent.requestPermission === 'function') {
    // Handle iOS 13+ devices.
    DeviceMotionEvent.requestPermission()
      .then((state) => {
        if (state === 'granted') {
          window.addEventListener('devicemotion', handleMotion);
        } else {
          console.error('Request to access the orientation was rejected');
        }
      })
      .catch(console.error);
  } else {
    // Handle regular non iOS 13+ devices.
    window.addEventListener('devicemotion', handleMotion);
  }
}
Hat tip to trekhleb.dev and web.dev for reference and inspiration.
Exploring the data
So now we have requested permission, let’s explore the the data returned from the motion event.
function handleMotion(event) {
    ...
}
The raw DeviceMotionEvent object looks like this:
DeviceMotionEvent {
  isTrusted: true,
  acceleration: {x: -0.016416461668629197, y: -0.008223821129091084, z: 0.03818447696566581},
  accelerationIncludingGravity: {x: 0.03576176159707829, y: -0.26739436074271794, z: -9.764901108551024},
  rotationRate: {alpha: -0.1024065136597755, beta: 0.03143359110734988, gamma: 0.0017918174194308646},
  interval: 0.01666666753590107
}
Acceleration
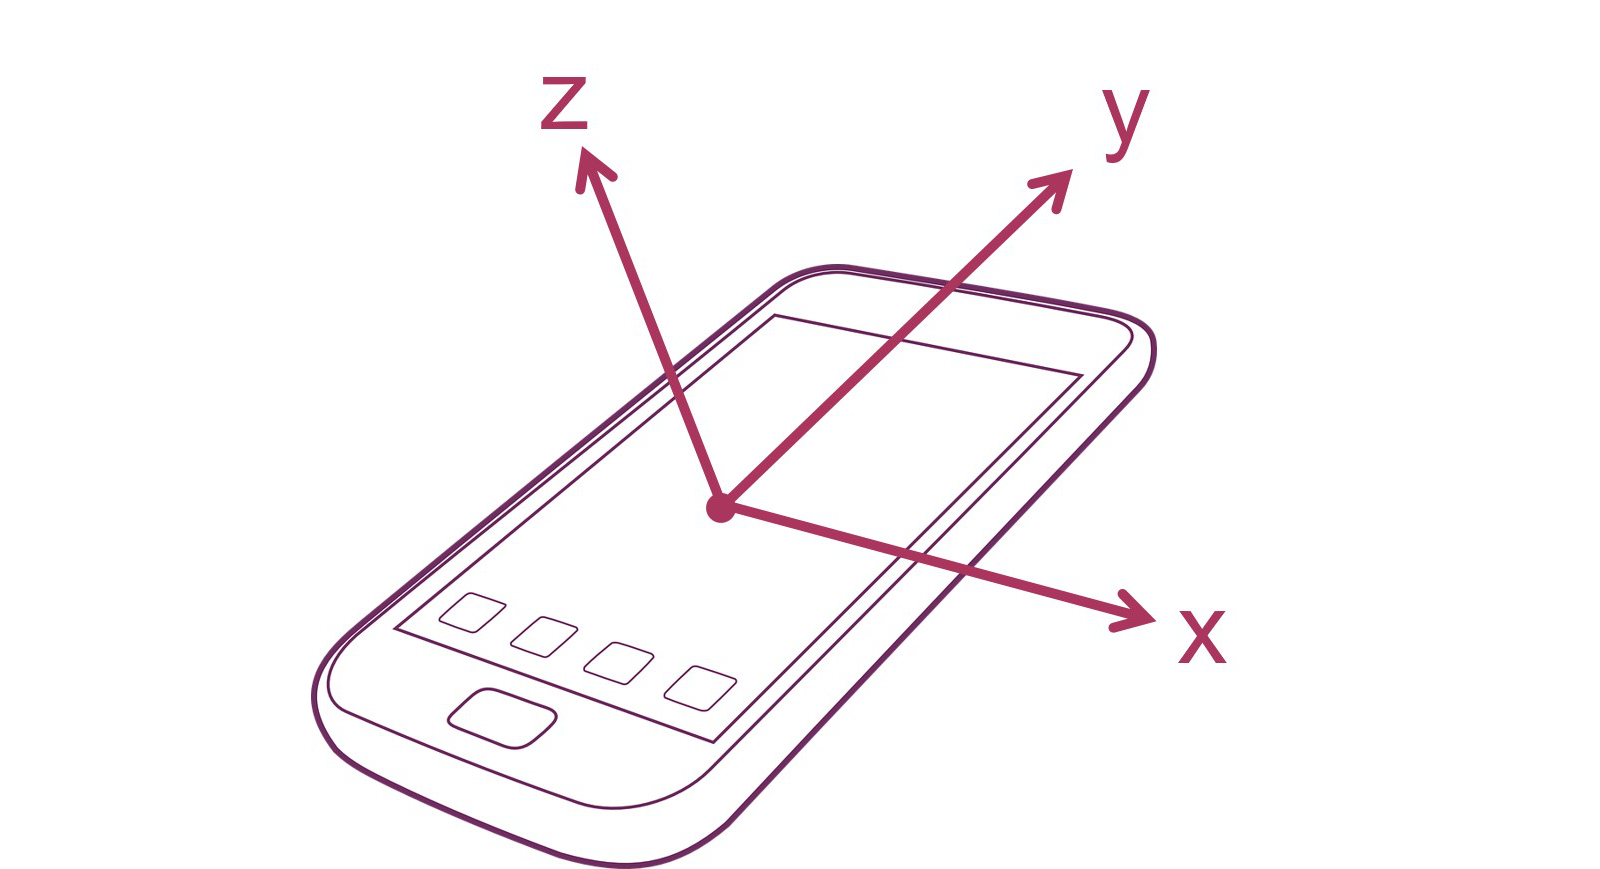
Acceleration is across three axes: x, y and z, and represents the acceleration in m/s squared.
Acceleration Including Gravity
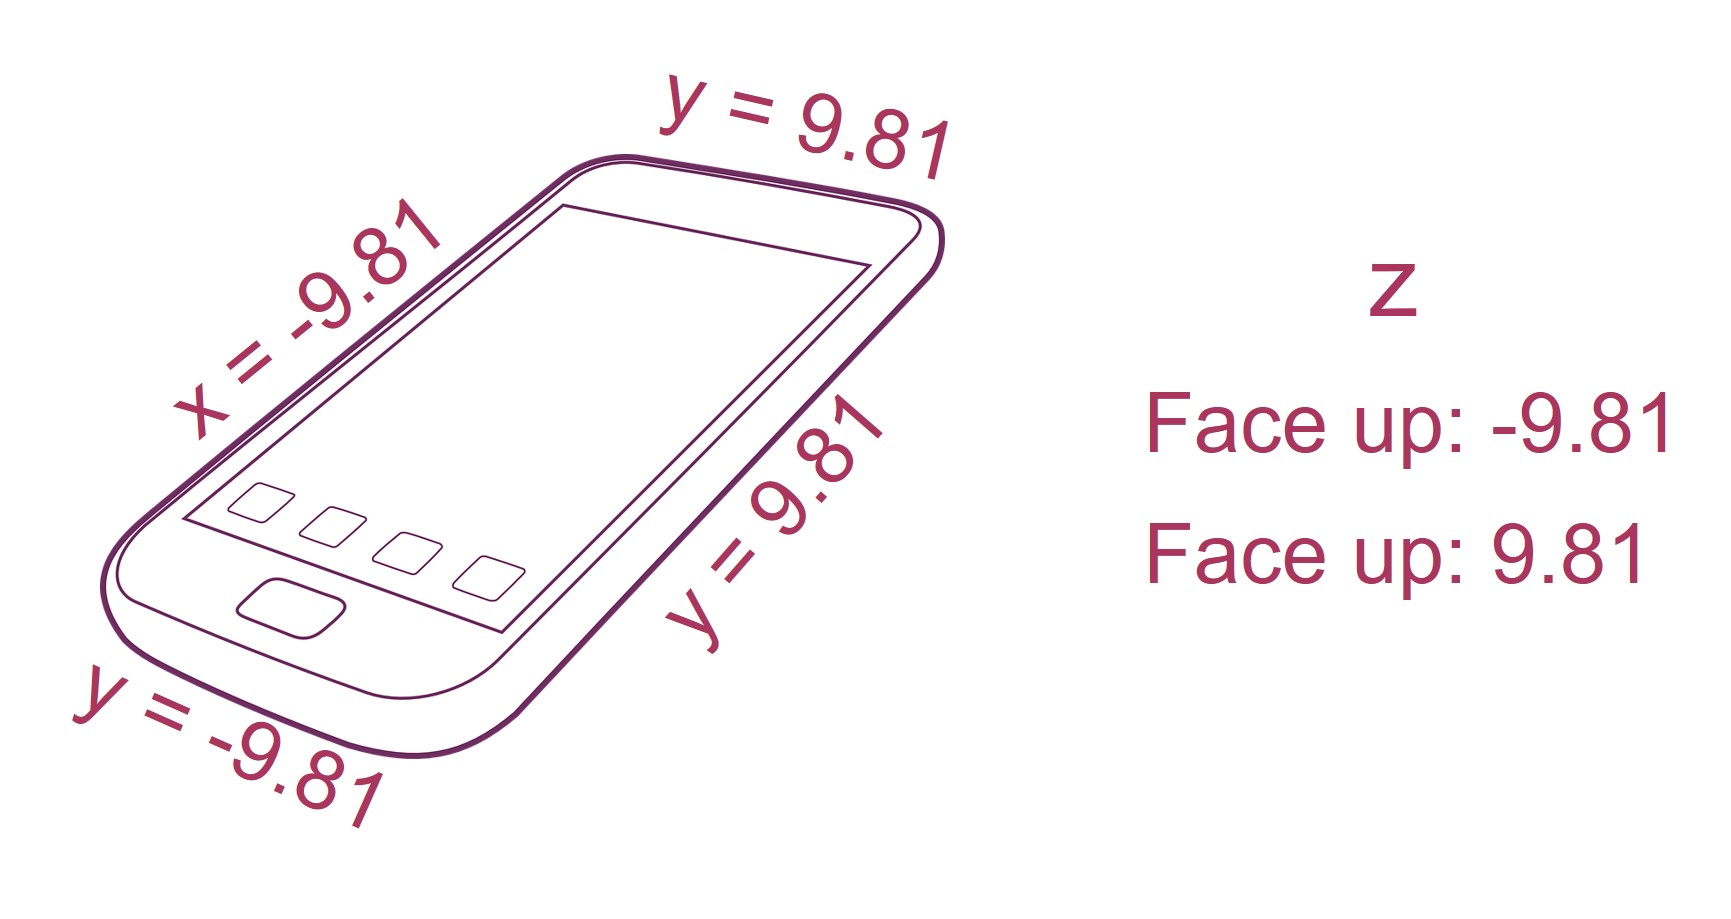
This is acceleration including the effects of gravity. I was more interested in establishing device orientation, so I subtracted the Acceleration axis from the Acceleration Including Gravity axis which left the orientation. The values range from -9.81 to 9.81 with 9.81 m/s squared being the acceleration due to gravity.
Using the x, y and z values, we can establish whether the device is:
- Upright
- Upside down
- On the right edge
- On the left edge
- Face up
- Face down
And every combination in between.
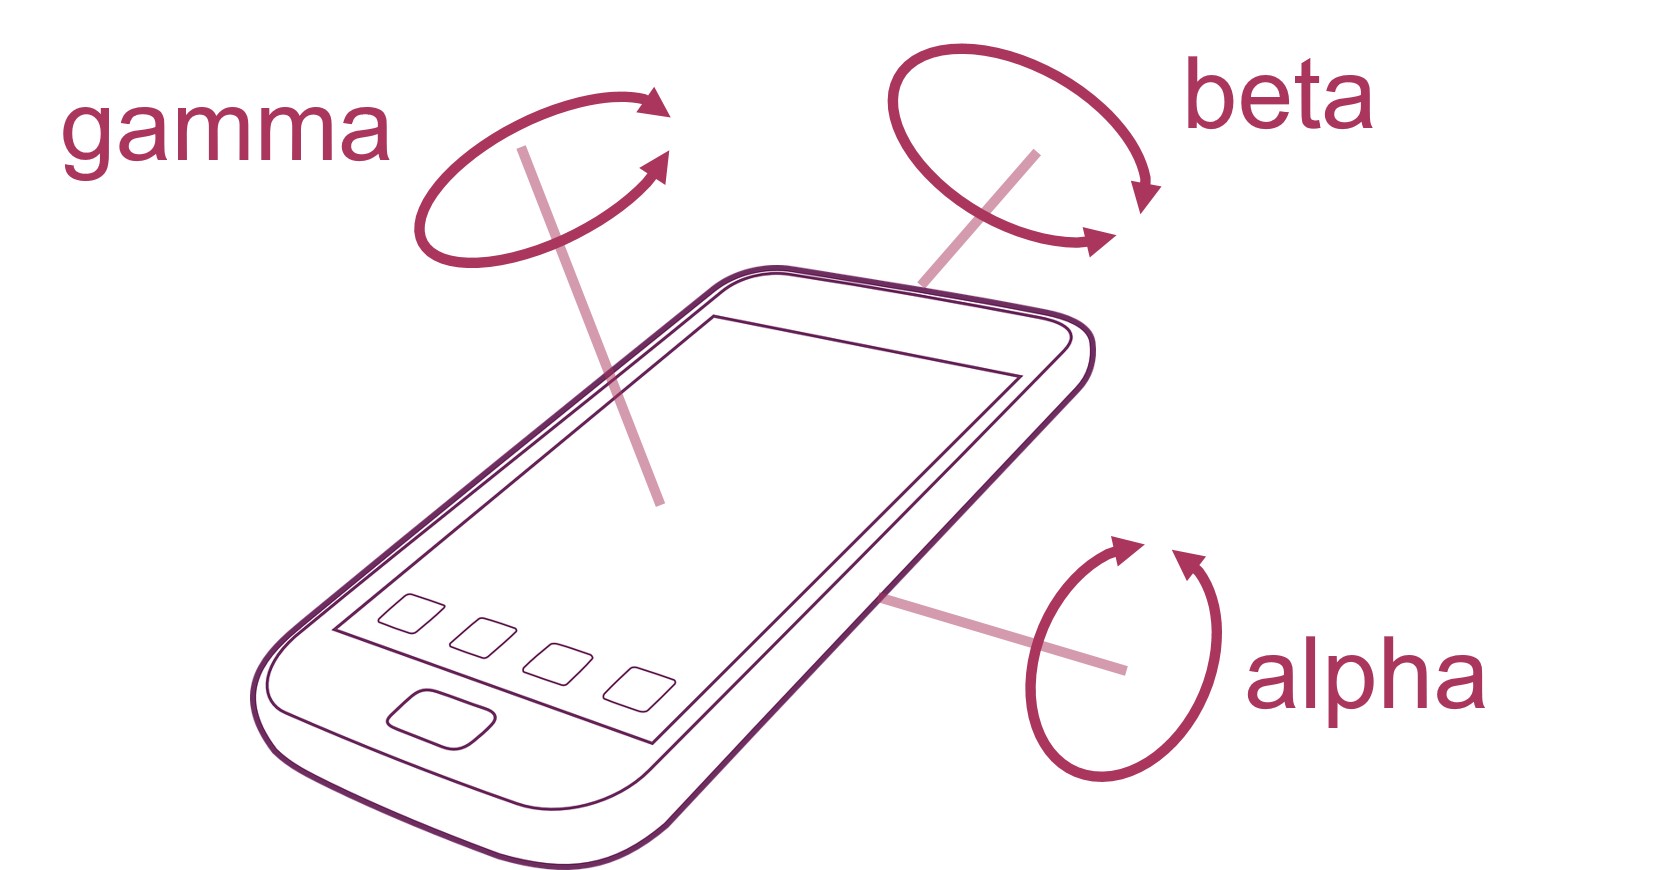
Rotation Rate
This is the angular rotation rate across three axes: alpha, beta and gamma, measured in degrees per second.
And finally, there’s Interval - the relative time since the last motion event.
Charting the data
Now that I had device motion data, I wanted to chart it in real time.
I came across a great library called smoothie.js. It’s simple to set up and is easy to configure / customise.

I needed three real time charts, with each axis plotted in a different colour for:
- Rotation rate
- Acceleration
- Device orientation
Initialising the charts
Each chart is initialised with three series, each one mapping to a sensor axis and a coloured line on the chart.
var rotationRateSeries1 = new TimeSeries();
var rotationRateSeries2 = new TimeSeries();
var rotationRateSeries3 = new TimeSeries();

var accelerationSeries1 = new TimeSeries();
var accelerationSeries2 = new TimeSeries();
var accelerationSeries3 = new TimeSeries();

var orientationSeries1 = new TimeSeries();
var orientationSeries2 = new TimeSeries();
var orientationSeries3 = new TimeSeries();

function createTimeline() {

  var rotationRateChart = new SmoothieChart({ responsive: true, scrollBackwards: false });
  rotationRateChart.addTimeSeries(rotationRateSeries1, { strokeStyle: 'rgba(255, 0, 0, 1)', fillStyle: 'rgba(255, 0, 0, 0.2)', lineWidth: 3 });
  rotationRateChart.addTimeSeries(rotationRateSeries2, { strokeStyle: 'rgba(0, 255, 0, 1)', fillStyle: 'rgba(0, 255, 0, 0.2)', lineWidth: 3 });
  rotationRateChart.addTimeSeries(rotationRateSeries3, { strokeStyle: 'rgba(0, 0, 255, 1)', fillStyle: 'rgba(0, 0, 255, 0.2)', lineWidth: 3 });
  rotationRateChart.streamTo(document.getElementById("rotation-rate-chart"), 500);

  var accelerationChart = new SmoothieChart({ responsive: true, scrollBackwards: false });
  accelerationChart.addTimeSeries(accelerationSeries1, { strokeStyle: 'rgba(255, 0, 0, 1)', fillStyle: 'rgba(255, 0, 0, 0.2)', lineWidth: 3 });
  accelerationChart.addTimeSeries(accelerationSeries2, { strokeStyle: 'rgba(0, 255, 0, 1)', fillStyle: 'rgba(0, 255, 0, 0.2)', lineWidth: 3 });
  accelerationChart.addTimeSeries(accelerationSeries3, { strokeStyle: 'rgba(0, 0, 255, 1)', fillStyle: 'rgba(0, 0, 255, 0.2)', lineWidth: 3 });
  accelerationChart.streamTo(document.getElementById("acceleration-chart"), 500);

  var orientationChart = new SmoothieChart({ responsive: true, scrollBackwards: false });
  orientationChart.addTimeSeries(orientationSeries1, { strokeStyle: 'rgba(255, 0, 0, 1)', fillStyle: 'rgba(255, 0, 0, 0.2)', lineWidth: 3 });
  orientationChart.addTimeSeries(orientationSeries2, { strokeStyle: 'rgba(0, 255, 0, 1)', fillStyle: 'rgba(0, 255, 0, 0.2)', lineWidth: 3 });
  orientationChart.addTimeSeries(orientationSeries3, { strokeStyle: 'rgba(0, 0, 255, 1)', fillStyle: 'rgba(0, 0, 255, 0.2)', lineWidth: 3 });
  orientationChart.streamTo(document.getElementById("orientation-chart"), 500);

}
Displaying data
When the motion event is called, we simply append the data to the appropriate timeline series. The smoothie.js library takes care of the managing the stale data once it’s gone off the chart.
function handleMotion(event) {

  let now = Date.now();
  rotationRateSeries1.append(now, event.rotationRate.alpha);
  rotationRateSeries2.append(now, event.rotationRate.beta);
  rotationRateSeries3.append(now, event.rotationRate.gamma);

  accelerationSeries1.append(now, event.acceleration.x);
  accelerationSeries2.append(now, event.acceleration.y);
  accelerationSeries3.append(now, event.acceleration.z);

  orientationSeries1.append(now, event.accelerationIncludingGravity.x - event.acceleration.x);
  orientationSeries2.append(now, event.accelerationIncludingGravity.y - event.acceleration.y);
  orientationSeries3.append(now, event.accelerationIncludingGravity.z - event.acceleration.z);

  updateState(event);

}
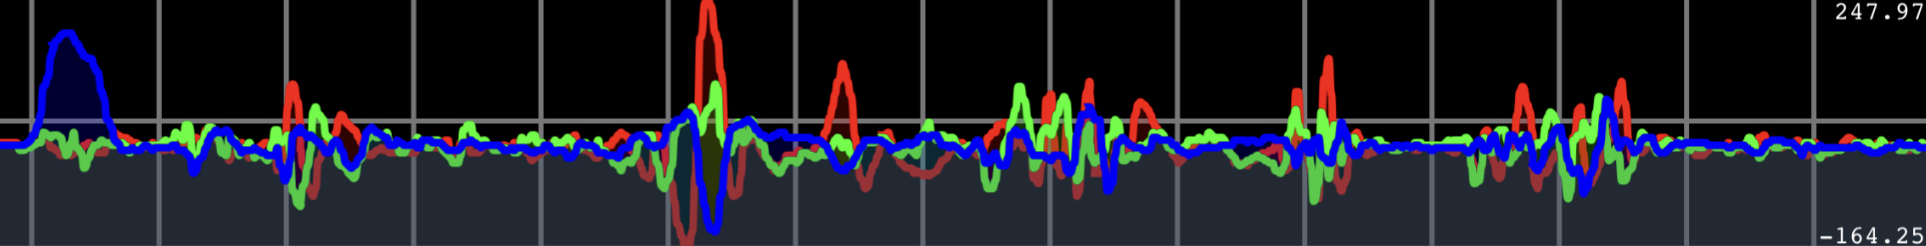
Here’s the final result running on an iPhone 13, in landscape mode.
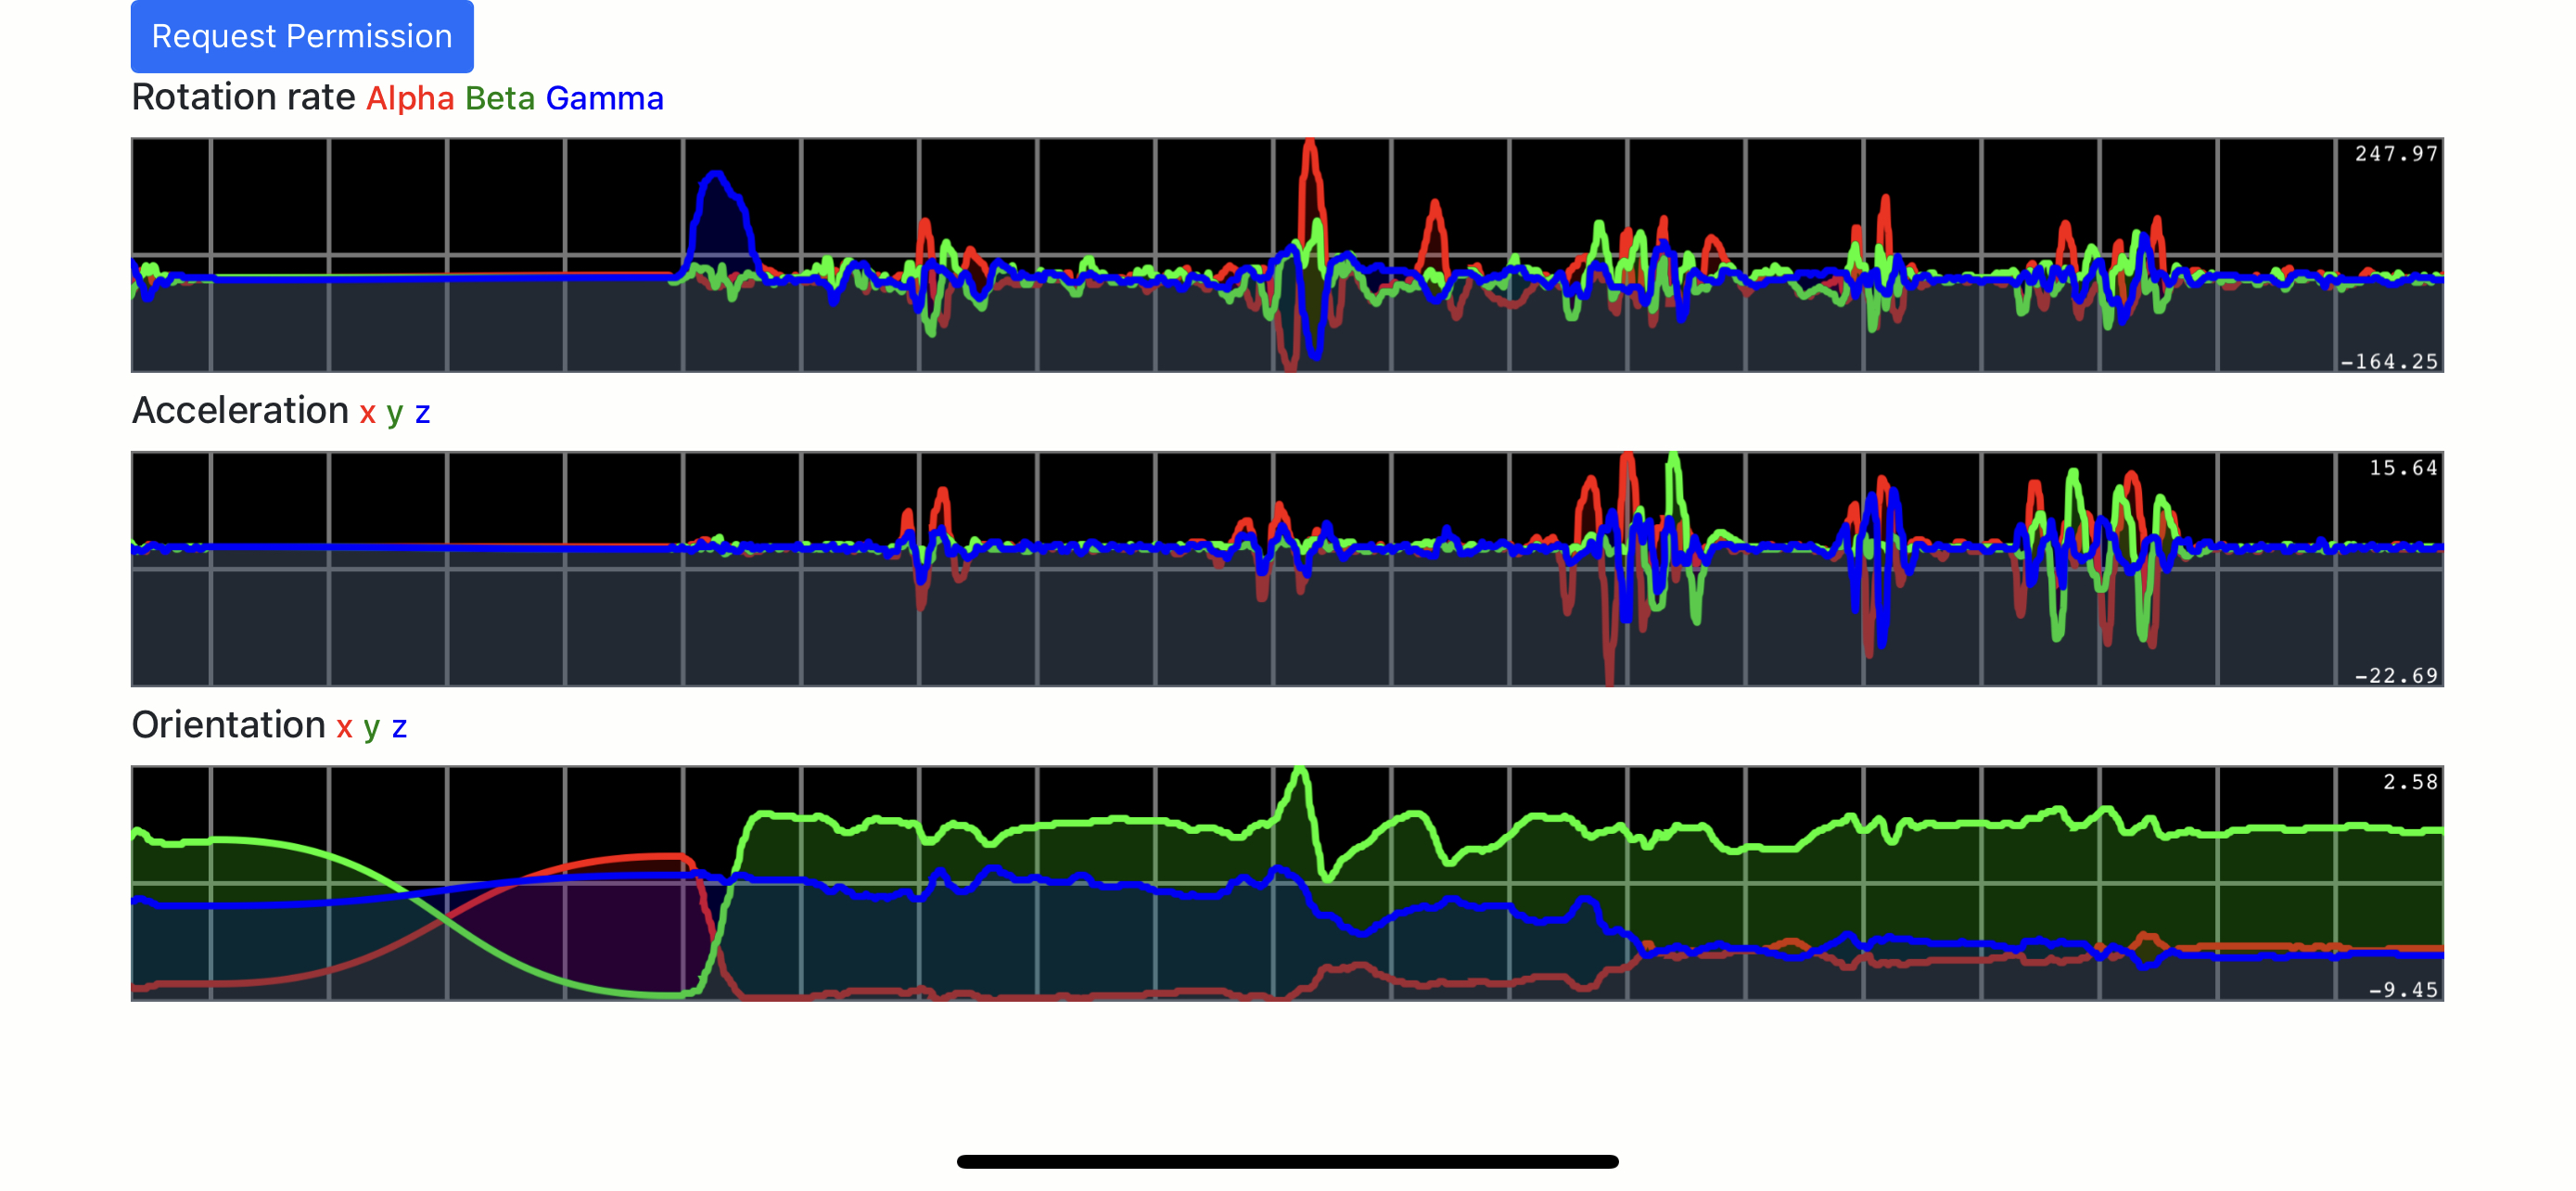 You can see the app running here. Visit this on mobile in landscape mode. Press the request permission button, accept the permission and you should see sensor data shown on the moving charts. I tested on an iPhone 13 using Safari (15.4.1) and Chrome (100.0.4896.77). At the time of writing, this app doesn’t work in the Brave mobile browser.
The code for the completed project is in the motion-sensor-chart repository on GitHub.
Next steps
Observing realtime sensor information was really useful and led me to writing a web app to stream the data to cloud-based storage for offline analysis and processing using machine learning. I’ll talk all about that in an upcoming post!